All data in the prototype is synthetic and not affiliated with any financial institution.
AI Data Investigator: Making AI Answers Verifiable for Financial Risk Analysts
A concept prototype on trust, transparency, and graceful recovery in AI-powered financial investigation.
Overview
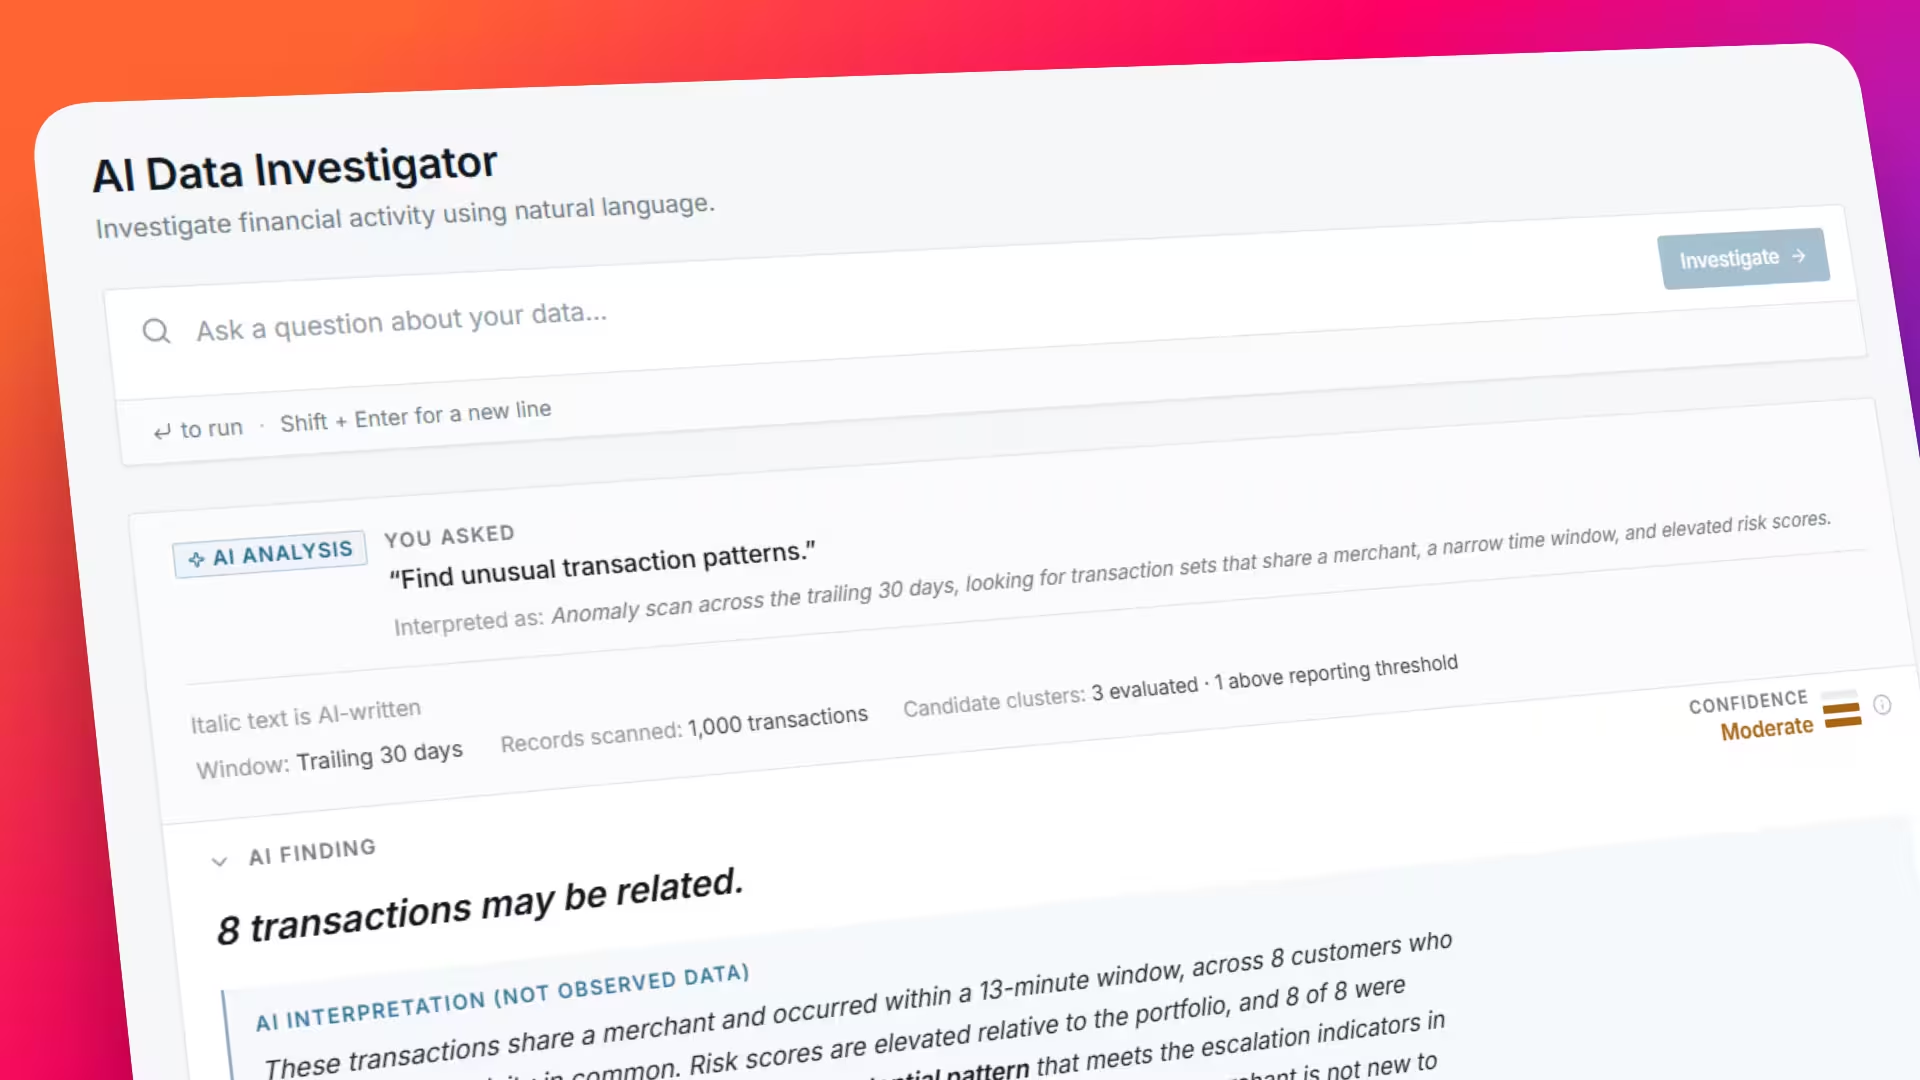
AI Data Investigator lets a risk analyst ask questions about transaction data in plain English. Instead of a paragraph, the AI returns a structured analysis:
- The AI's findings.
- How confident it is and why.
- The evidence behind it's conclusions.
- The SQL it generated and why.
- The transactions queried through the SQL.
- Relevant policies it considered and why.
Who It’s For
An experienced risk analyst that's fluent in data but not necessarily in SQL. A risk analyst's goal is to identify, evaluate, and minimize potential threats that could harm an organization's financial health.
My role
Solo product designer and builder. I defined the problem and AI UX patterns to establish trust and transparency. I directed development with an AI coding agent, and tested the output to find and fix where the AI got things wrong.
| Type | Self-initiated concept |
|---|---|
| Timeline | 3 days |
| Tools | Claude Code, React, TypeScript, Tailwind CSS, Netlify |
| Focus | Explainability · Confidence indicators · Error recovery · RAG · Permission-aware AI · Prototyping in code |
At A Glance
Problem
A chatbot connected to a database gives answers analysts can’t verify. In regulated finance, an answer you can’t verify is a liability.
Approach
Answers separate data from interpretation, explain their confidence, expose their evidence and sources, fail honestly, and respect access permissions.
Outcome
A working, hosted prototype over 1,000 synthetic transactions: 5 AI response examples covering multiple scenarios.
The Problem
Risk analysts spend their day answering why:
- Why did payments fail?
- Why is this merchant spiking?
- Which transactions need review?
The answers are in the data, but getting to them usually means writing SQL or waiting on someone who can. Can AI solve this? The common pattern, a chat window connected to a database, returns a fluent paragraph with no way to verify it.
In a consumer app, a wrong answer is an annoyance. In a bank, an analyst who escalates or clears a case on a wrong AI answer creates regulatory exposure and real harm to customers.
So the design question wasn’t “how do I make AI answer questions?” It was “how do I make its answers verifiable?”
Ask → Analyze → Understand → Verify → Dive Deeper
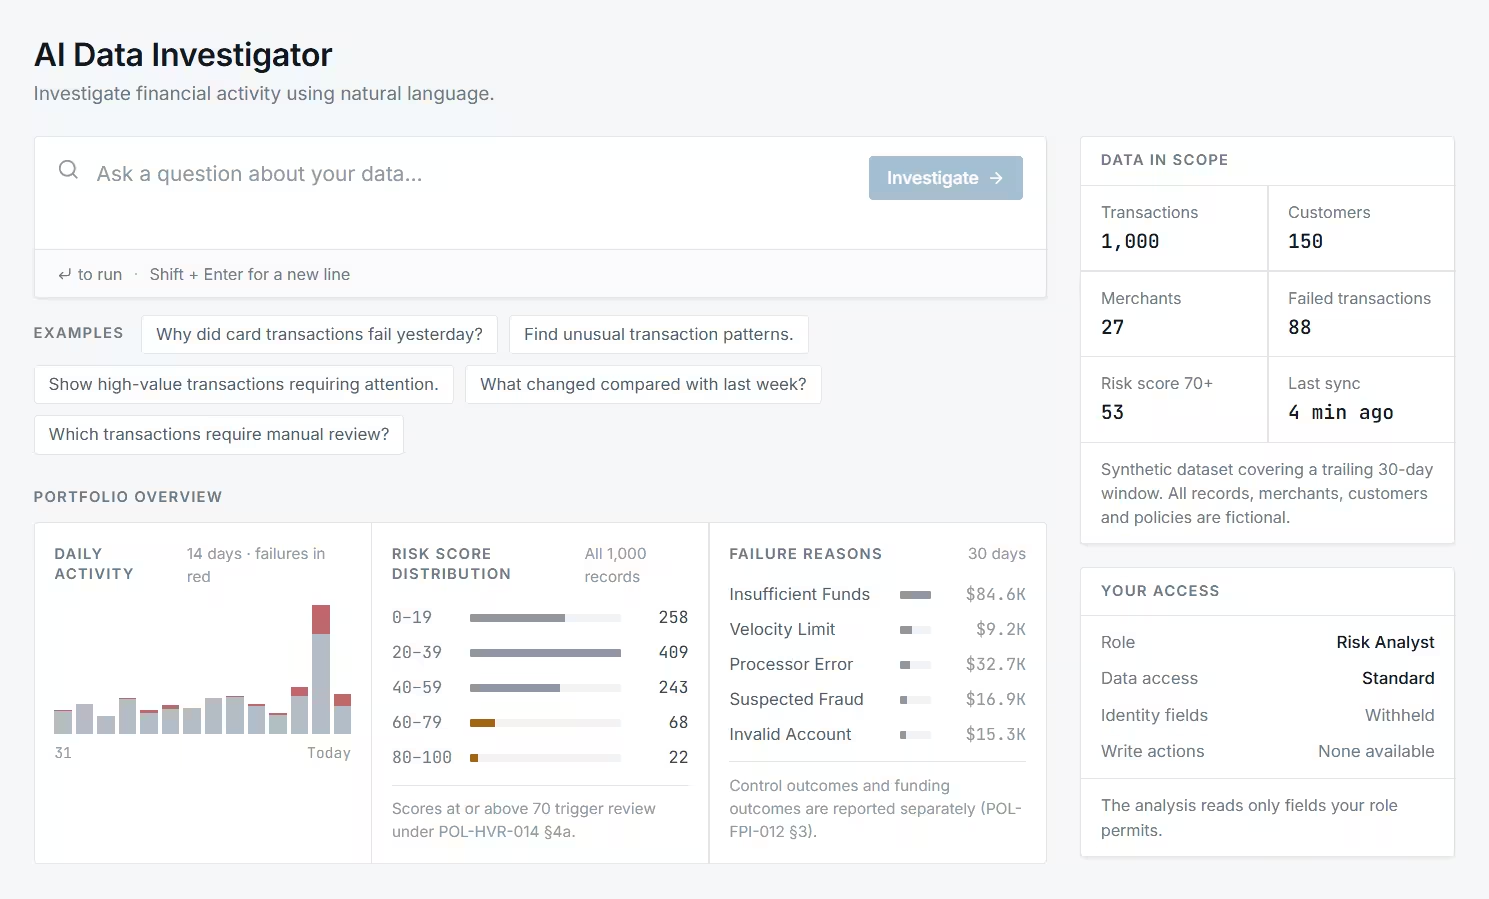
The analyst asks a question, the AI analyzes the data, and the answer is structured so the analyst can understand it, verify it, and dive deeper.
Key Design Decisions
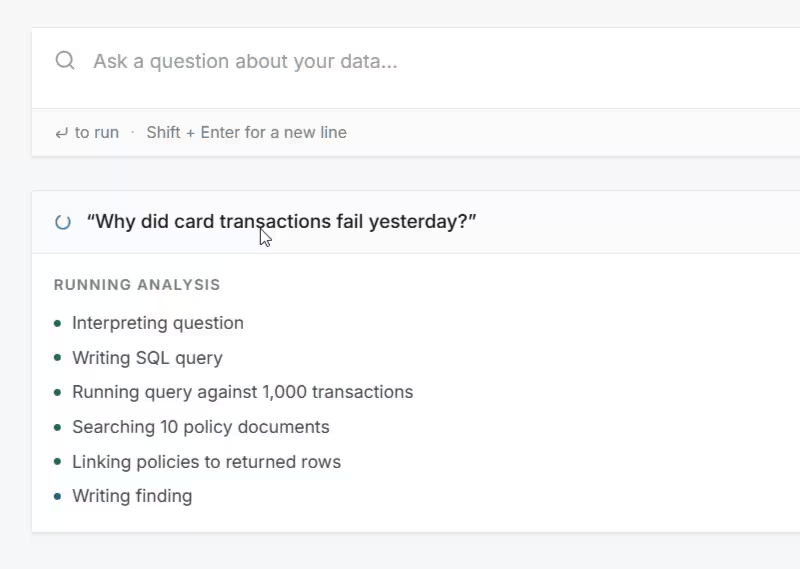
1. Transparent AI Loading Patterns
Instead of a mysterious black box that spits out a response to a prompt, the loading spinner and progress bullets show that the AI is reading the data, generating SQL, and analyzing the results. The user can see the AI is working on their question and what it’s doing.
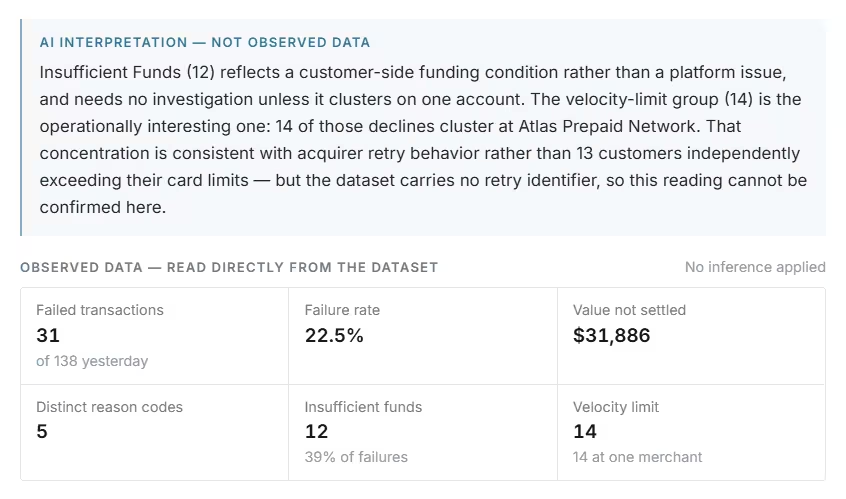
2. AI Insights vs Real Data
The actual SQL query results the AI is reading from are displayed for the user. The AI can answer questions based on these results, but the distinction between the real query results and AI interpretation is maintained. The two never blend.
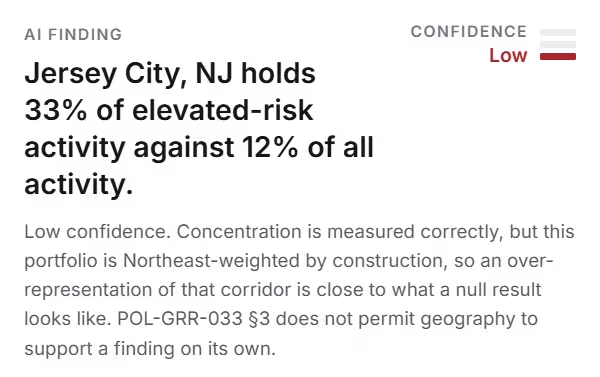
3. Clear Confidence Scores
Every answer carries a High, Moderate, or Low rating plus a written rationale stating what the confidence doesn’t cover.
The language intentionally avoids definitive statements. The geographic analysis goes further, rating its own result Low and arguing against it.
4. Verify For Yourself
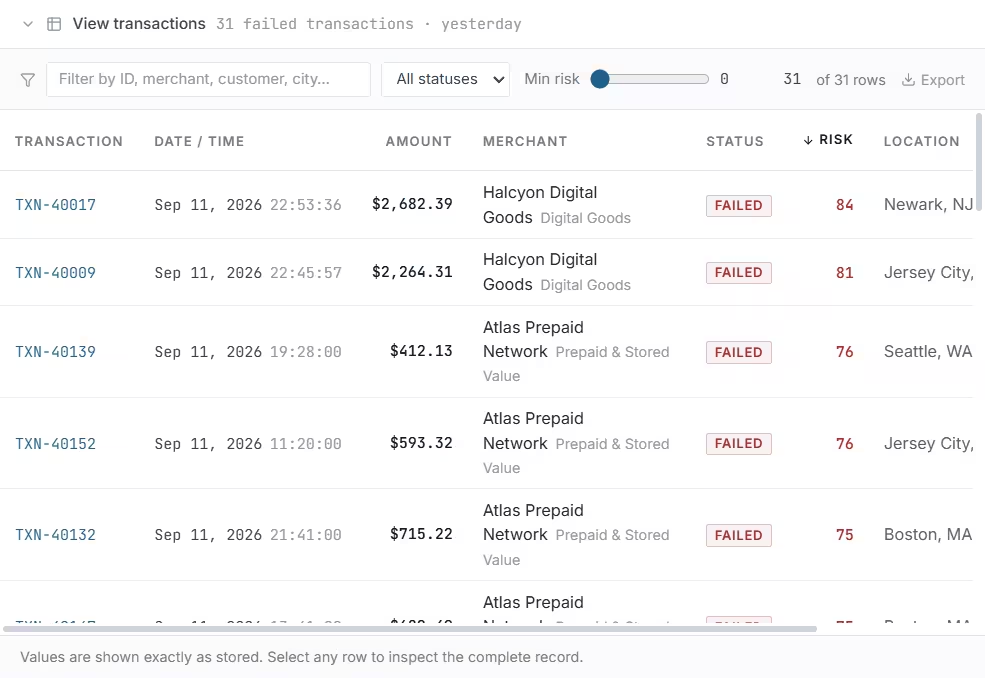
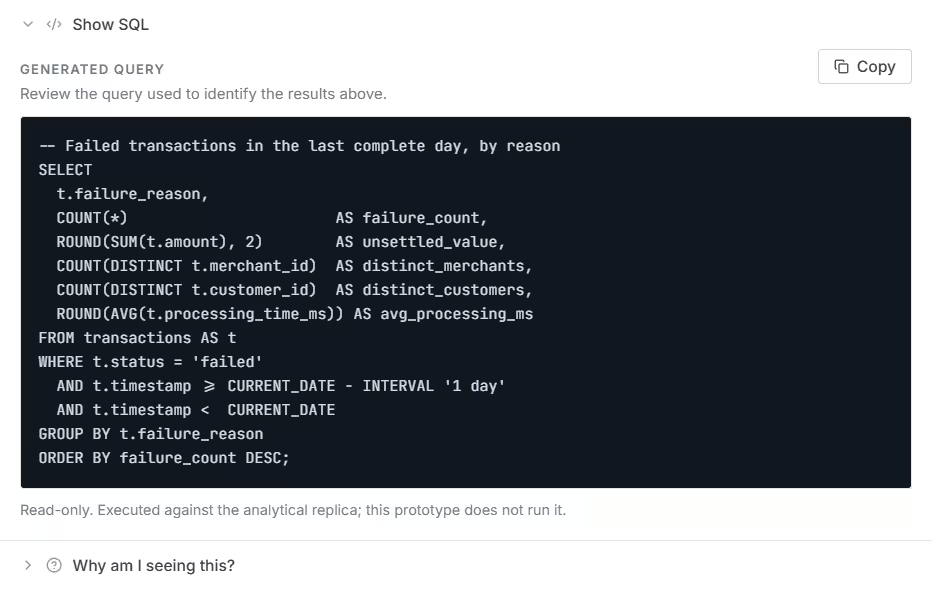
The generated SQL, relevant transactions, and reasoning are showcased in every AI response.
- "View transactions" Section: a sortable, filterable table of the records behind the finding. Any row opens its full detail.
- "Show SQL" Section: a technical analyst can verify how their question became a query.
5. Sources the AI Can Cite (RAG)
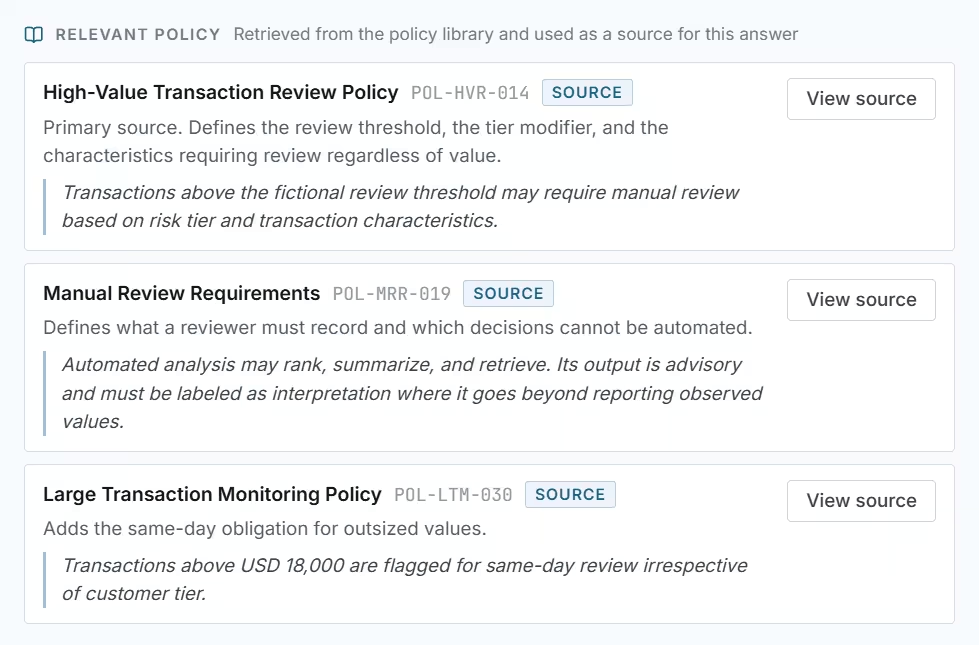
Policy questions retrieve from a library of fictional policy documents. The answer shows the exact passage it relied on, labelled as a source, and View source opens the full document.
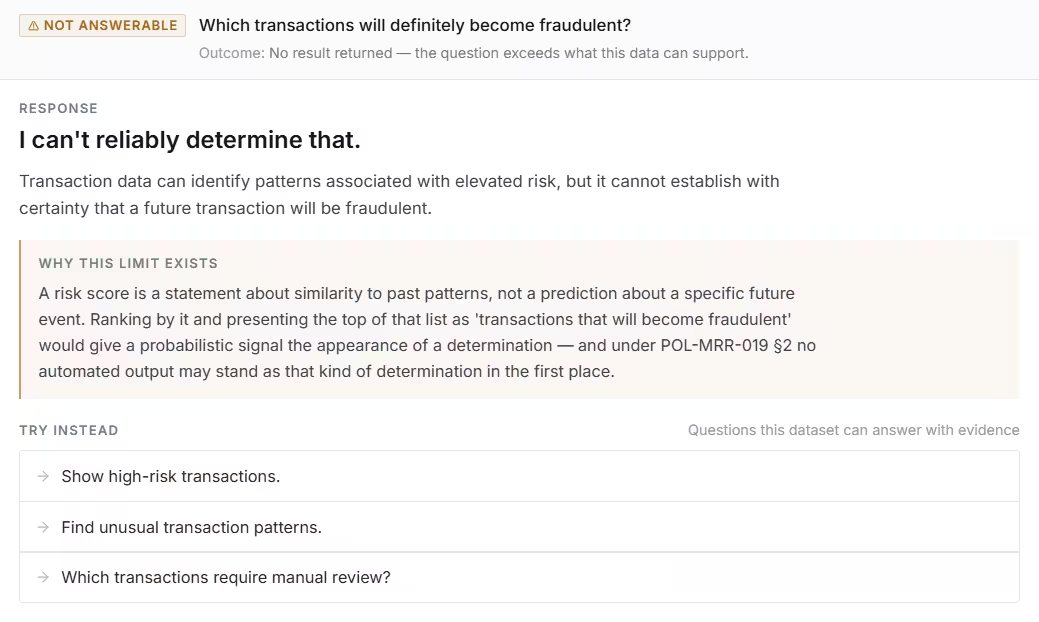
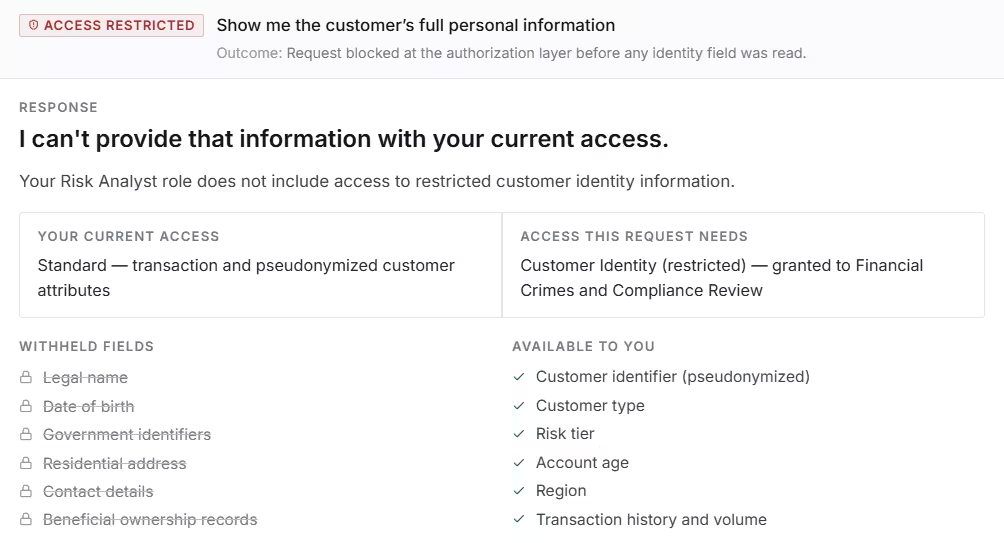
6. Ensuring the AI Refuses to Answer When It Shouldn’t
The AI is trained to refuse questions it can’t answer, and to explain why. Two common cases are uncertainty and permissions:
- Uncertainty: “Which transactions will definitely become fraudulent?” returns “I can’t reliably determine that.” The AI explains how it cannot predict the future and suggests follow-up questions that the data can answer.
- Permissions: “Show me the customer’s full personal information” explains that a Risk Analyst role doesn’t include identity data, lists what’s withheld and what’s available, and offers a path to the permitted information. Access is enforced before the AI analysis runs so the AI never reads restricted fields and then summarizes around them.
7. The AI Recommends & The Analyst Decides
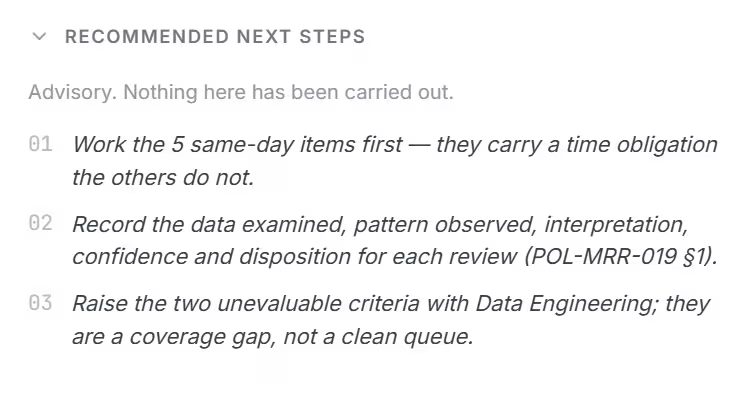
Suggested next steps are labelled "Advisory. Nothing here has been carried out." Labels like "Interpreted as..." and use of italics to distinguish all AI-generated writing allow the analyst to make up their own mind based on not only the recommendations, but more importantly, the real data.
Building It: Prototyping with Data




I built a working React prototype rather than static mockups, directing development with an AI coding agent. Code let me test what a mockup can’t: how the design behaves against real (synthetic) data.
-
Data with something to find.
1,000 transactions and 150 customers, generated to intentionally contain these patterns:
- A suspicious-looking merchant cluster
- A merchant repeatedly resubmitting declined card authorizations (a “retry storm”)
- High-value risk
- Geographic concentration
- The response template creates predictable AI output. Every answer must fill in the same structure: observations, evidence with its basis, a confidence rationale, assumptions, and SQL. An answer that can’t explain itself can’t be displayed.
- A retrieval source. 10 fictional policy documents stand in for a bank’s policy library.
Mistakes Found and Lessons Learned
Mistake 1
The AI Generated Unrealistic Datasets
The first dataset reported a 50.7% failure rate for a single day. This would be unrealistic to analysts. The data was rebalanced so the spike day reads as a genuine spike (about 22%), with a cause the analysis explains.
Lesson: In a domain tool, whether the numbers are believable is part of the UX.
Mistake 2
AI-Selected Data Wasn't Clearly Labeled as Such
I initially had all AI text displayed in italics. But what about the fact that real data was being selected by the AI?
I needed to explain that the sampled data was real, but still selected by the AI. Now the AI explains what data it chose to display and why.
Lesson: Being transparent about AI-generated writing is crucial. But transparency about all AI decisions is essential.
Outcome
Live
A live, shareable prototype tested end to end: ask, analyze, inspect, verify, follow up.
Outputs
5 AI response examples and 3 response types (answer, an honest “can’t answer” for impossible questions, and access-restricted responses for when it doesn't have access necessary to answer a question).
Every answer
Carries confidence, rationale, underlying transactions, generated SQL, and cited sources in the form of policy documents.
How I’d measure success
- Verification rate: how often analysts read why the AI did what it did before acting. If not often enough, this signals over-trust.
- Decision quality: how many of the AI's recommendations are correct based on manual review by analysts.
- Time to decision: compared with existing analyst workflows.
- Recovery rate: after a user gets stuck, how often the next question succeeds.
WHAT’S NEXT
The next step is making this pattern real across the organization.
User research
Shadow 3–5 risk analysts, and test whether separating data from interpretation actually changes what they write in case notes.
Accessibility
Confidence and risk currently rely on color. Add non-color cues and run a WCAG 2.2 AA audit.
Design system
Turn the patterns (confidence meter, evidence item, source citation, refusal card) into reusable components for other AI features or make use of existing design system components.
A real model
The LLM would turn questions into queries and write the explanation around the computed results. It would never generate the numbers itself, so the SQL and evidence views become the verification layer.
REFLECTION
Designing AI for financial services isn’t about making the AI sound smarter.
It’s about making it honest about what it knows, clear about what it doesn’t, and easy to verify, so the person accountable for the decision can trust the right answers and catch the wrong ones.